










Use operational indicators to improve service capacity without confusing bookings with financial results.
Before you start
- Choose the question and comparison period.
- Keep booking statuses current.
Interpret operational indicators
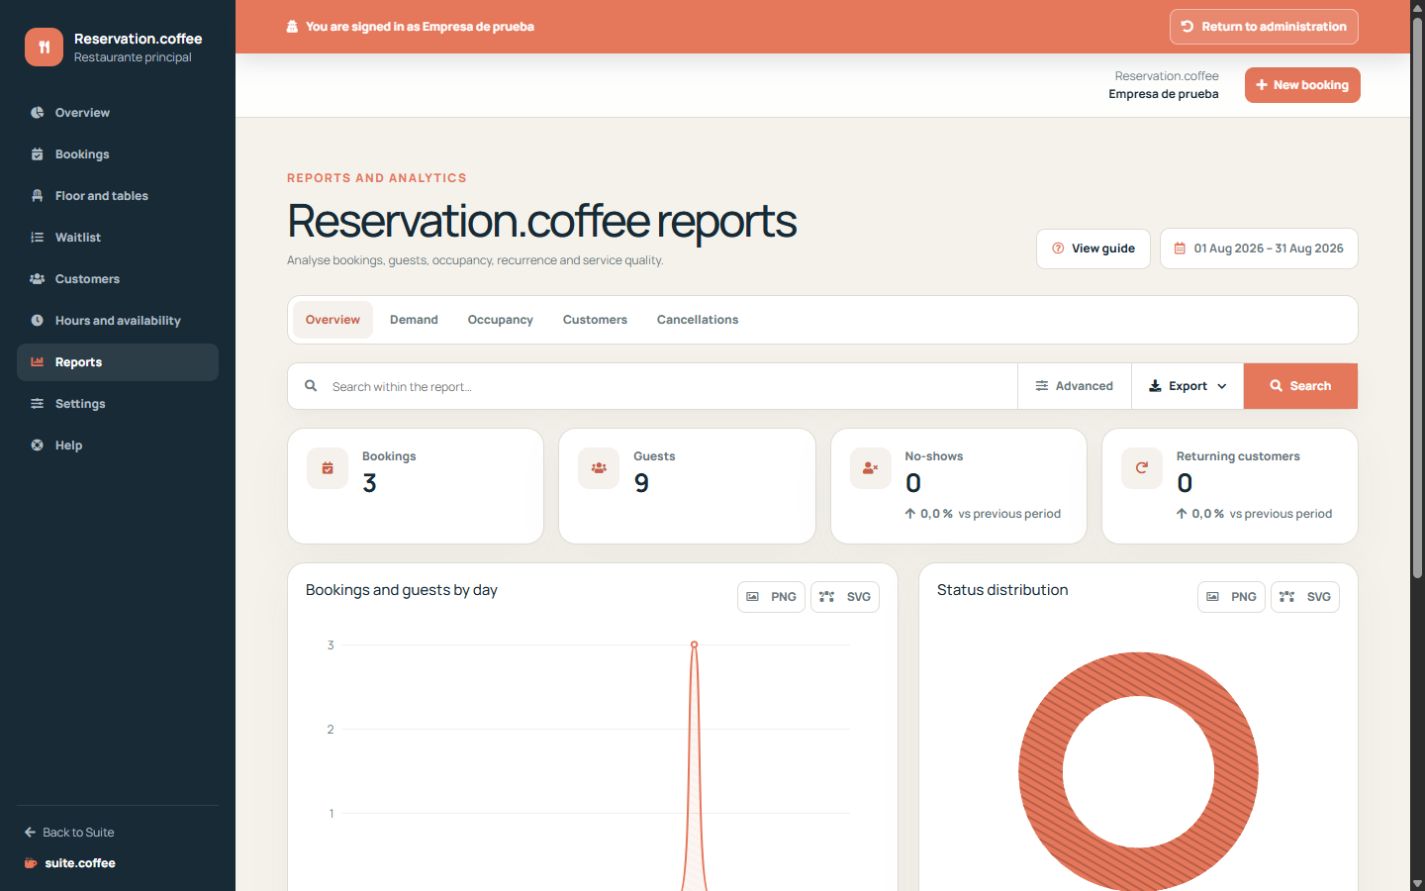
Reports show bookings and covers by day, demand by hour, table usage, status distribution, recurrence and no-shows. Cancelled records remain historical but do not represent served demand.
Apply filters and period
Use a consistent date range before comparing charts and exports. Downloaded files are point-in-time copies of the selected scope.
Keep financial meaning separate
Deposit amounts and booking counts are operational data, not bank movements, invoiced revenue or accounting recognition.
Step by step
- Open Reports and choose the period.
- Select bookings, hours, tables or status analysis.
- Compare headline totals with daily and categorical detail.
- Apply supported filters before interpreting changes.
- Export the current scope when a static copy is needed.
Final check
- The same period is used across comparisons.
- Cancelled and no-show records are interpreted correctly.
- Deposits are not described as collected revenue.
Tip: Update booking outcomes after service; stale confirmed records distort attendance and no-show analysis.